
Think Ancient History and Social Network Analysis don’t go together? Think again! Today we’ll give you a little taste of social network analysis, explaining some basic concepts and why every self-respecting historian should use it.
 We should pause here and warn you though: we are NOT SNA guru’s, despite us being worshipped by our department colleagues. We are, first and foremost, historians, lovers of all things antique (preferably Graeco-Roman in Egypt). About a year ago, we started to explore the subtle science of social network analysis. We’ve come a long way since then, but we’re basically still rookies compared to the many die-hard sociologists, mathematicians, computer wizzes and all out there. And now the SNA community has welcomed us with open arms and bathtubs full of beer, we find it hard not to think of our ancient data in networky ways.
So, first of all, what is social network analysis (SNA) all about? As with everything, there are many different definitions floating about but we’ve tried to keep it simple and clear for you.
SNA is a quantitative and qualitative analysis of a social network.
Now why in the world would historians of all species want to apply SNA to their data?!
It’s true, we’ve met our fair share of historians who confess that the reason they chose for or stumbled into a career that focuses on the past was their irrational fear of math, no, generally all things even remotely numerical. But SNA is so much more than numbers! For us (and this might cause die-hard SNA’ists to frown in contempt, but remember, this will only speed up your wrinkling process and cost you more in the facial cream department), visualization is the first key to success! Reconstructing past networks and looking at their visualizations literally lets you see things from a different perspective than when staring at the texts themselves. When working with hundreds of individuals in dozens of texts, as we often do, it’s hard to keep a structured overview, and those dots and the lines connecting them give you just that. Measures such as centrality then help detect crucial actors and links that do not always stand out in narrative. For example, we often work with archives, and publications and studies of these texts mainly focus on the lead actor, so the one who compiled the archive, since he appears in most documents. But SNA can point us to other less conspicuous actors in those texts that were nonetheless very important, perhaps as bridges between different groups in society.
So, what will we be using SNA for, you ask? Well, the cool thing is, almost anything can be approached as a network, as SNA focuses on relationships between people or entities. Yanne set up a network of names with directed links between names of parents and their offspring. Unfortunately it turned out to be a huge failure since she made a mistake while collecting her data. Yep, we often learn the hard way. Anywho, at the moment we’re using network visualizations to identify people that appear in multiple texts, but for whom we have no info other than their given name. Silke will also be looking into the relations between witnesses, scribes and contracting parties in Demotic contracts, and Yanne will submerge herself into the world of the local “Greek” elite of Roman Egypt.
Social network
So you start with a social network, which is a structure made up of actors/entities (e.g. people, companies etc.) and their relationships. What happens to an actor is dictated by his position and the structure of his connections: this will determine which information or resources will (or will not) reach him and will therefore influence his behavior or beliefs.

Fig. 1
These entities are called the nodes or vertices of a network. The relationships are what we call the ties or edges of a network. Matrices and graphs can be used to visualize this structure.
A matrix sounds like a pretty scary thing, but not to worry! It’s actually quite a straightforward arrangement of our data.
The matrix that is commonly used in SNA is the adjacency matrix. This is a simple square table with the same number of rows and columns as there are nodes. The information in the cells tells us something about the ties between each pair of these nodes. Let’s take a look at the matrix of our first Harry Potter-example (fig. 1)!
| Adjacency Matrix | Harry Potter | Hermione Granger | Ron Weasley |
| Harry Potter | 0 | 1 | 1 |
| Hermione Granger | 1 | 0 | 1 |
| Ron Weasley | 1 | 1 | 0 |
Graphs are another important part in the process of analyzing a social network as it presents the data in a very different way than the rather old-fashioned tables.
 Fig. 2 |
 Fig. 3 |
The graph on the right represents the table on the left, which is actually six pages long! We think it’s fair to say that the graph shows our data in a much clearer way than the table does. To interpret this kind of graph, you need to know a thing or two about some basic SNA concepts.
Relationships
So, we’ve already had the pleasure of being introduced to nodes and edges but now it’s time for a more intimate rendez-vous. Edges, which represent the relationships between nodes, can be directed or undirected. On the left there’s an example of an undirected network and on the right one with directed edges.
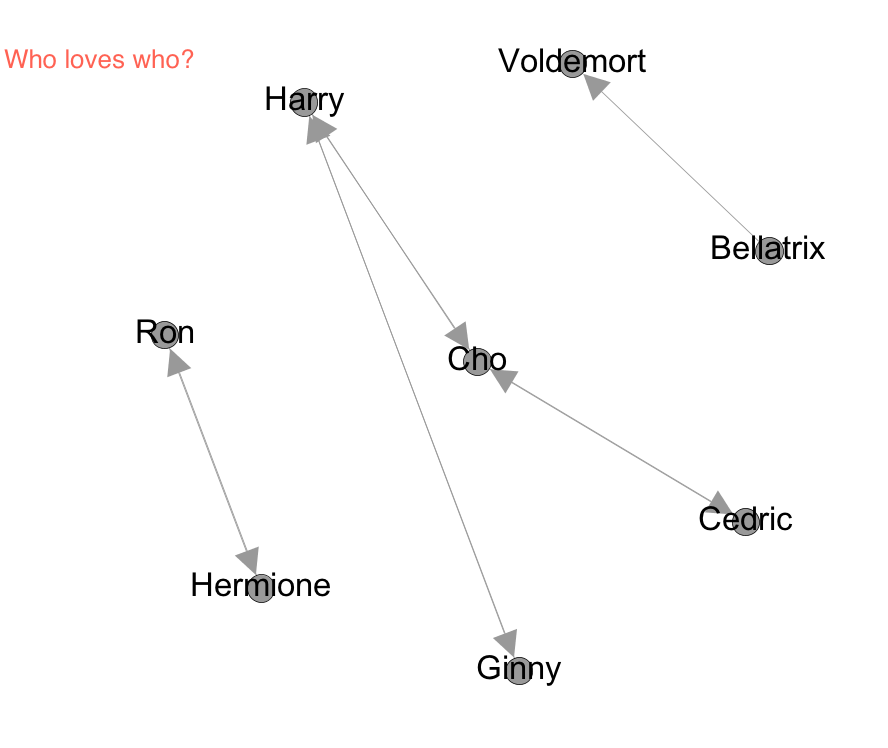 Fig. 4 |
Fig. 5 |
Undirected networks can be used to represent family ties, taste-related beers, drug cartels, anything you like! Directed networks are used to display information (or other) flow from one actor to another: for example letters written or insults hurled from one person to another, or even how STD’s are passed on.
Besides being directed or undirected, these edges can also have a weight attributed to them. If not, it’s assumed their weight is 1 (as in fig. 4). In the example of our “Who loves who”-network (fig. 5), we have different weighted edges. The couples Harry/Ginny and Hermione/Ron both are in reciprocated relationships and so their weight is 2.
Harry loves Ginny =1
+ Ginny loves Harry =1
weight =2
On the other hand we all know that Beatrix drools all over Lord Voldemort but her affections are not returned in the same way. So that makes 1.
Beatrix loves Voldemort =1
but Voldemort does not love Bellatrix =0
weight =1
Geodesic distance
The geodesic distance is simply the length of the shortest path between two nodes. In the undirected who-knows-who network (fig. 4), the geodesic distance between all two nodes is 1, since everyone is connected to everyone else. In the directed who-loves-who network (fig. 5), the geodesic distance between Ginny and Cedric is 3, since she can only reach him through Harry and Cho.
Degree & degree centrality
The degree of a node is the number of edges that start from or point to a node. So in the who-knows-who network (fig. 4), all actors have a degree of 5, because they are all connected to each other. When the network is directed, there’s a difference between in-degree and out-degree. In the last example (fig. 5), Beatrix has an out-degree of 1 and no in-degree. Voldemort has exactly the opposite: 1 for in-degree and no out-degree.
The degree of a node can point to a high centrality of that node in the overall network. It is the most commonly used centrality measure for SNA, but it’s worth looking at other centrality measures as they may reveal other entities that have a more hidden centrality.
Betweenness centrality
One of those hidden centralities is the betweenness centrality, where we take a look at how often a node lies on the shortest path between two other nodes. The more a node appears on one of those shortest paths, the higher its betweenness centrality. A node with high betweenness is also called a broker as it fulfills a brokerage position in the network, which means that information needs to pass through that entity to be shared by the other nodes. This also means that these nodes are often the vulnerable points of a network: by cutting them out, chances are the network will fall apart into unconnected components.
 Fig. 6 |
Fig. 7 |
(Figures 6 and 7 are actually the same network, but we changed the size of the nodes according to the type of centrality we wanted to emphasize: in fig. 6, the larger the nodes, the higher their degree vs betweenness centrality in fig. 7)
If we take up a Harry Potter example again, then we can see that Severus Snape is the ultimate broker (fig. 7). The “goodies”, i.e. the members of the Order of the Phoenix share information with each other but they don’t know what the baddies, i.e. the Death Eaters, are up to. That’s where Snape comes in handy, since he has links with both the goodies and the baddies. So although Dumbledore has the highest degree in this information network (fig. 6), Severus Snape has the highest betweenness and therefore, in this situation, is more centrally placed to convey or obtain information. But once Snape dies…
Density
Density measures whether there is much cohesion in the network. It is calculated by dividing the number of attested edges by the number of all the possible edges, resulting in a number between 0 and 1. A density of 0 means that all nodes are drifting around helplessly on their own, while in networks with a density of 1 everyone is connected to everyone else, like in the who-knows-who network (fig. 4) we showed before. The density of the Order of the Phoenix vs Death Eaters network (fig. 6 & 7) is 0.484, so this means that 48.4% of all possible ties are present here.
But we’ve already been told-off that this post is too long, so if you want to keep up with our SNA adventures and find out more about out research, tune in to our blog and let your inner spaghetti-monster lover run free!

Thanks for this cogent overview of the different types of centrality.
NetMiner is very useful for this analysis